Drill Press Pulley Speed Chart: How to Read and Use It
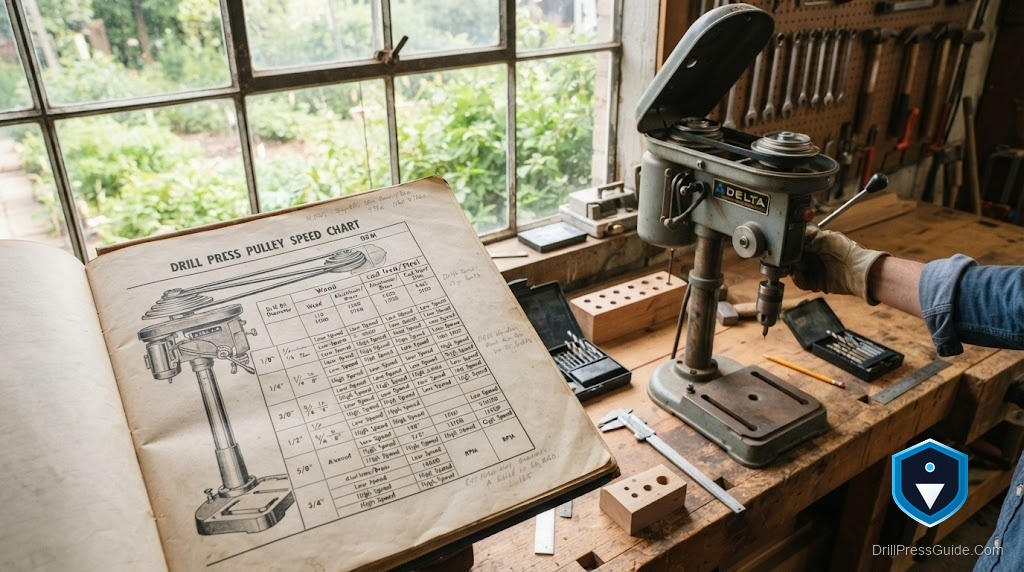
The stack of stepped pulleys inside a drill press looks complicated, but it is really just a set of gears you shift by moving a belt. The pulley speed chart is the map that tells you which shift gives which speed. Once you can read it, choosing the right spindle speed becomes a ten-second lookup instead of a guess, and your bits and holes will thank you.
A drill press pulley speed chart is a table that shows, for each combination of motor pulley groove and spindle pulley groove, the spindle speed in RPM that results when the belt runs between them. It exists because the speed of a belt drive is set entirely by the size ratio of the two pulleys the belt connects, and the chart lists the outcome of every available combination so you do not have to calculate ratios yourself.
Here is the direct answer on using it. First, choose the speed you need from the bit and material: large bits and hard metal call for low RPM, small bits and wood for high RPM. Second, locate that speed, or the nearest available one, in the chart. Third, read off which motor groove and which spindle groove the belt must connect to produce it; the pulleys are stepped so that a small driving groove and a large driven groove give low speed, and the reverse gives high speed. Fourth, unplug the machine, move the belt onto those two grooves, and re-tension. The chart turns the pulley geometry into a simple pick-a-speed lookup.
Why pulley size sets the speed
A belt drive changes speed through ratio. The motor turns at a fixed speed, and the belt carries that motion to the spindle. If the belt runs from a small pulley on the motor to a large pulley on the spindle, the spindle turns slower than the motor, giving low speed and more twisting force. If it runs from a large motor pulley to a small spindle pulley, the spindle turns faster than the motor, giving high speed and less force. The stepped pulley stacks simply give you several of these ratios to choose from, and the chart names the RPM each one yields.
That is the whole mechanism. Understanding it means the chart stops being a mystery grid and becomes obvious: you are reading which ratio a given belt position sets, and the RPM listed is the result. It also explains why low speeds come with more torque, which is exactly what large bits in metal need.
Reading and applying the chart
Most pulley charts are drawn as a diagram of the pulley steps with speeds labeled for each belt position, or as a grid crossing motor grooves with spindle grooves. To use it, find your target RPM among the listed values and trace it to the belt position, the specific pair of grooves, that produces it. Then set the belt there with the power off. If the exact RPM you want is not offered, pick the closest available and lean toward the slower side for larger bits and harder materials.
Many charts also print recommended speeds by material and bit diameter alongside the pulley grid, which lets you go straight from your job to a belt position. If yours does not, a general cutting-speed reference or the bit manufacturer’s chart provides the target RPM. Whenever you move the belt, follow the Occupational Safety and Health Administration’s guidance: unplug the machine, then close the guard before switching on. Re-tension the belt to about half an inch of flex so it neither slips nor strains the bearings.
Comparison: pulley chart versus doing the math
Using the pulley chart gives you the exact RPM for every belt position at a glance, with no calculation and no error, but only for the speeds your specific pulley steps provide.
Calculating the ratio yourself from pulley diameters and motor speed can find a value not printed on the chart, but it takes measurement and math and invites mistakes.
My verdict: use the chart, it is faster and already correct for your machine. Only reach for the ratio calculation if the chart is missing or you have swapped in non-standard pulleys, in which case measuring the pulley diameters and applying the motor speed gives you the number the chart would have shown.
Conclusion
The pulley speed chart translates the drill press’s belt-and-pulley geometry into a simple list of speeds. Pick the RPM your bit and material need, find it on the chart, connect the belt to the grooves shown, and re-tension. Understanding that speed comes from the pulley size ratio makes the chart intuitive, and using it means you always drill at a speed you chose on purpose rather than one you settled for.
Key takeaways:
- Spindle speed is set by the size ratio of the two pulleys the belt connects.
- Small driving to large driven gives low speed and more torque; the reverse gives high speed.
- Find your target RPM on the chart, set the belt to the grooves shown, and re-tension with the power off.
FAQ
What is a drill press pulley speed chart? A table showing the spindle RPM produced by each combination of motor and spindle pulley grooves.
How does pulley size set speed? A small motor pulley driving a large spindle pulley gives low speed and more torque; a large driving a small gives high speed.
How do I use the chart? Choose the RPM your bit and material need, find it on the chart, and set the belt to the pulley grooves shown.
Why do low speeds have more torque? Gearing down from motor to spindle trades speed for twisting force, which large bits in metal need.
What if my target speed is not listed? Pick the closest available, leaning slower for larger bits and harder materials.
Can I calculate speed without the chart? Yes, from the pulley diameters and motor speed, but the chart is faster and less error-prone.
How tight should the belt be after moving it? About half an inch of flex under a firm push, so it neither slips nor strains the bearings.
References
- Occupational Safety and Health Administration, Woodworking eTool: Drill Presses (osha.gov)
- Machinery’s Handbook, Industrial Press, pulley ratios and cutting speeds